Digital Twins and Smart and Sustainable Urban Mobility Planning
Boost your skills in Digital Twins and Computer Vision- apply them with confidence to real-world mobility challenges.
This e-course provides immersive, hands-on experience in developing and utilizing a Digital Twin platform integrated with Computer Vision (CV) models for intersection monitoring and public transport optimization. It also emphasizes the extraction of traffic-related key performance indicators (KPIs) from video streams to enhance public transport efficiency and inform the optimization of sustainable urban mobility strategies.
This course is designed for a diverse audience, including urban mobility planners, traffic engineers, CV and AI specialists, transport system analysts, researchers in smart cities and travel behavior and entry-level and mid-career professionals in transport modeling and planning. Whether you’re just beginning your journey in transport planning and modeling or aiming to enhance your initiatives at the local or regional level, this course offers valuable insights and practical resources to support your progress.
Learning objectives
By the end of this module, learners will be able to:
- Explain the core concept and architecture of Digital Twins (DTs).
- Evaluate their role in smart and sustainable urban mobility planning.
- Identify practical applications in traffic management and public transport systems.
- Analyze real-world implementations from European smart city initiatives.
Module Topics
- What is a Digital Twin?
- Digital Twins in the context of smart cities and urban transport systems.
- Evolution of traffic monitoring systems: From traditional manual counts to real-time video analytics.
- Real-time data and video-based analytics in urban mobility management.
- Benefits of Digital Twins for sustainability, congestion mitigation, emissions monitoring, and policy-making.
- Case studies – smart intersections and public transport optimization in European cities.
Key Concepts and Content
- What is a Digital Twin?
- A Digital Twin (DT) is a dynamic, digital representation of a physical system – such as roads, vehicles, or intersections- continuously updated with real-time data. It mirrors the behavior and conditions of its real-world counterpart, enabling simulation, monitoring, and prediction of real-world performance. By integrating live and historical data, a Digital Twin reflects both current and past states while modeling potential future scenarios.
- The technology operates by gathering information from sensors and other connected data sources embedded in the physical asset or system it replicates. This continuous flow of data keeps the virtual model synchronized with reality. In addition to real-time monitoring, a DT can process historical records, run “what-if” simulations, forecast outcomes, and generate insights that guide decision-making and system optimization. In some cases, it can directly influence the physical environment – enabling real-time adjustments and interventions based on intelligence derived from the model.
 In short, a Digital Twin doesn’t just mirror the physical world-it helps predict, simulate, and optimize it.
Relevance to Smart Urban Mobility
- In the context of urban mobility, a Digital Twin can represent anything from individual vehicles and fleet operations to transport infrastructure and entire city-wide mobility networks. This capability:
- Empowers city planners to test and optimize transport interventions in a safe, virtual environment.
- Provides data-driven insights into congestion patterns, pedestrian and cyclist safety, public transport delays, emission hotspots, and shifts between transport modes.
- Supports evidence-based policy for developing and implementing Sustainable Urban Mobility Plans (SUMPs).
Example: A city planner can test new bus lanes in a DT before implementing them on real streets.
Application in the SPINE Project
- Within the SPINE Project, a Digital Twin is leveraged to enhance various aspects of urban mobility management, including:
- Traffic management and flow monitoring to alleviate congestion.
- Public transport optimization for improved punctuality, service efficiency, and passenger travel experience.
- User engagement through a dedicated mobile application (e.g. Citizen App) that provides real-time travel information.
- Emergency response coordination to improve incident detection and response times.
Use Case: Intersection Monitoring and Public Transport Optimization
Through CV technology, the Digital Twin enables real-time detection and tracking of vehicles, pedestrians, and cyclists at intersections and along transport routes. This data is transformed into actionable metrics such as:
- Vehicle counts by type (cars, buses, trucks, bicycles, etc.).
- Pedestrian volume and average waiting times at crossings.
- Lane occupancy rates to identify bottlenecks.
- Public transport delays for service performance monitoring.
- Congestion and incident detection to support quick response measures.
These capabilities provide city planners, transport operators, and emergency services with precise, up-to-date information to make informed decisions, improve service reliability, and enhance overall urban mobility.
How would you apply Digital Twins to solve congestion issues in your city?
Learning Objectives
By the end of this module, learners will be able to:
- Understand the core concepts of CV in the context of traffic and mobility systems.
- Object detection, tracking, and classification of multiple road users (pedestrians, cyclists, buses, cars) techniques to real-world traffic scenes.
Module Topics
- Core CV tasks: object detection, multi-object tracking, and classification.
- Open-source tools and libraries for mobility-focused CV projects.
- Datasets and annotation standards for traffic applications.
- Real-time deployment challenges in traffic scenes.
- Inclusive monitoring of multiple road users (pedestrians, cyclists, buses, cars).
Key Concepts and Content
- What is the core concept of computer vision (CV) in the context of traffic and mobility systems?
- In the context of traffic and mobility systems, CV refers to the use of algorithms and visual data (e.g., camera feeds) to automatically interpret and analyze elements of the transport environment.
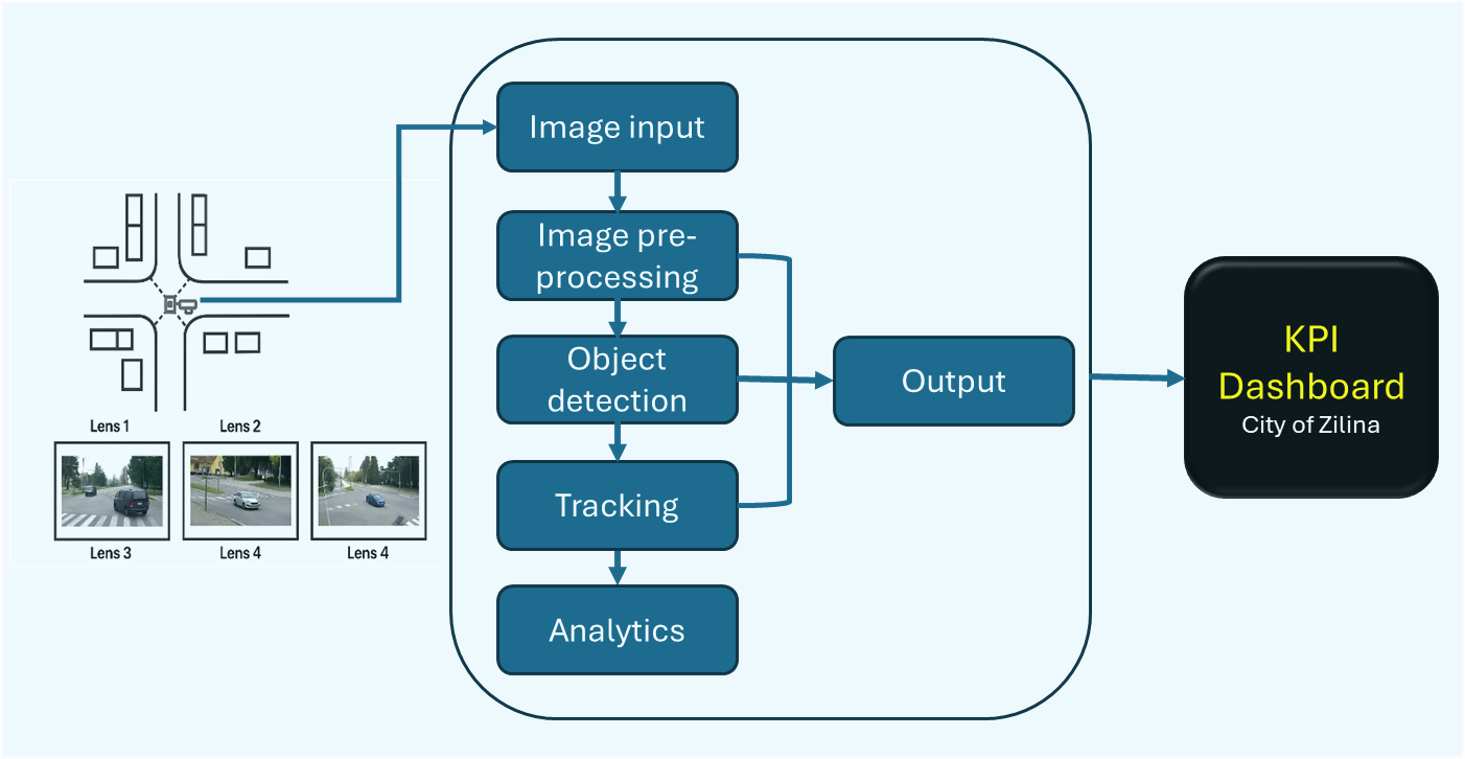
- The CV pipeline refers to the structured sequence of steps or components involved in processing visual data (e.g., images or video) to extract meaningful information, make decisions, or support automation. In the context of traffic and mobility systems, the CV pipeline enables real-time analysis and understanding of the transport environment through camera-based systems for:
- Real-time monitoring,
- Data-driven planning,
- Enforcement,
- And future-oriented mobility solutions (like Digital Twins and smart intersections).
Overview of the core concepts of CV applied in traffic and urban mobility systems domain
- Object Detection in Traffic Scenes and Classification
- Definition: Identifying and categorizing objects (vehicles, pedestrians, bicycles, buses, etc.) in traffic scenes.
- Applications:
- Differentiating between vehicle types (e.g., car, truck, bus).
- Detecting vulnerable road users (pedestrians, cyclists).
- Monitoring compliance with road rules (e.g., bus lanes).
- Object Tracking
- Definition: Following the movement of detected objects across frames to understand trajectories and interactions.
- Applications:
- Tracking vehicles at intersections to analyze turning movements.
- Measuring pedestrian crossing times.
- Monitoring vehicle dwell time at traffic lights or bus stops.
- Traffic Flow Analysis
- Definition: Quantifying vehicle or pedestrian volumes, speeds, densities, and movements over time.
- Applications:
- Counting vehicles per lane.
- Detecting congestion or queue lengths.
- Evaluating the impact of signal timing changes.
- Incident and Anomaly Detection
- Definition: Automatically identifying unusual or dangerous situations (e.g., accidents, stalled vehicles, illegal U-turns).
- Applications:
- Triggering alerts for emergency response.
- Detecting red-light running or pedestrian violations.
- Monitoring wrong-way driving or stopped vehicles.
- License Plate Recognition
- Definition: Automatically reading and identifying license plates from video feeds.
- Applications:
- Traffic law enforcement (speeding, tolling).
- Vehicle re-identification across intersections.
- Parking and access control.
- Scene Understanding and Semantic Segmentation
- Definition: Understanding the structure of the road scene by labeling pixels or regions with classes (road, sidewalk, crosswalk, lane markings).
- Applications:
- Dynamic lane detection.
- Crosswalk monitoring.
- Supporting autonomous navigation and advanced driver-assistance systems (ADAS).
- Integration with Geographic and Temporal Context
- Definition: Linking visual data with map-based data (GIS) and temporal data (timestamps, time of day).
- Applications:
- Spatiotemporal mobility pattern analysis.
- Linking traffic data to specific locations or routes.
- Assessing the effect of time-dependent interventions (e.g., peak hours vs. off-peak).
Which CV application could most improve transport safety in your context?
Learning Objectives
- By the end of this module, learners will be able to:
- Build the CV pipeline for monitoring intersections.
- Identify traffic metrics for public transport optimization.
Key Concepts and Content
- Architecture of the CV-based Digital Twin system, camera input to insights.
- Traffic flow and congestion analysis.
- Counting vehicles, buses, cyclists, and pedestrians.
- Public transport performance metrics (e.g., headway, travel time at intersections).
- System architecture: camera input to insights.
- Extracting travel times, average speeds.
- Defining KPIs for intersection efficiency.
Case study analysis
The City of Žilina, as part of the SPINE Living Lab activities, deployed a CV-based Digital Twin at its busiest intersections located in the city’s second traffic circle.
- Key Features of the Deployment:
-
- High-definition cameras capturing real-time vehicle, bus, cyclist, and pedestrian flows.
- AI-powered object detection and tracking for accurate and continuous monitoring.
- Possible integration into the city’s traffic management system, enabling direct feedback into signal control and planning.
Results:
- Public Transport Reliability: reduced Peak-hour bus delays.
- Balanced Mobility: Reduced Pedestrian waiting times without negatively impacting bus punctuality.
Safety Gains: Safer cyclist crossings through improved signal phasing adjustments
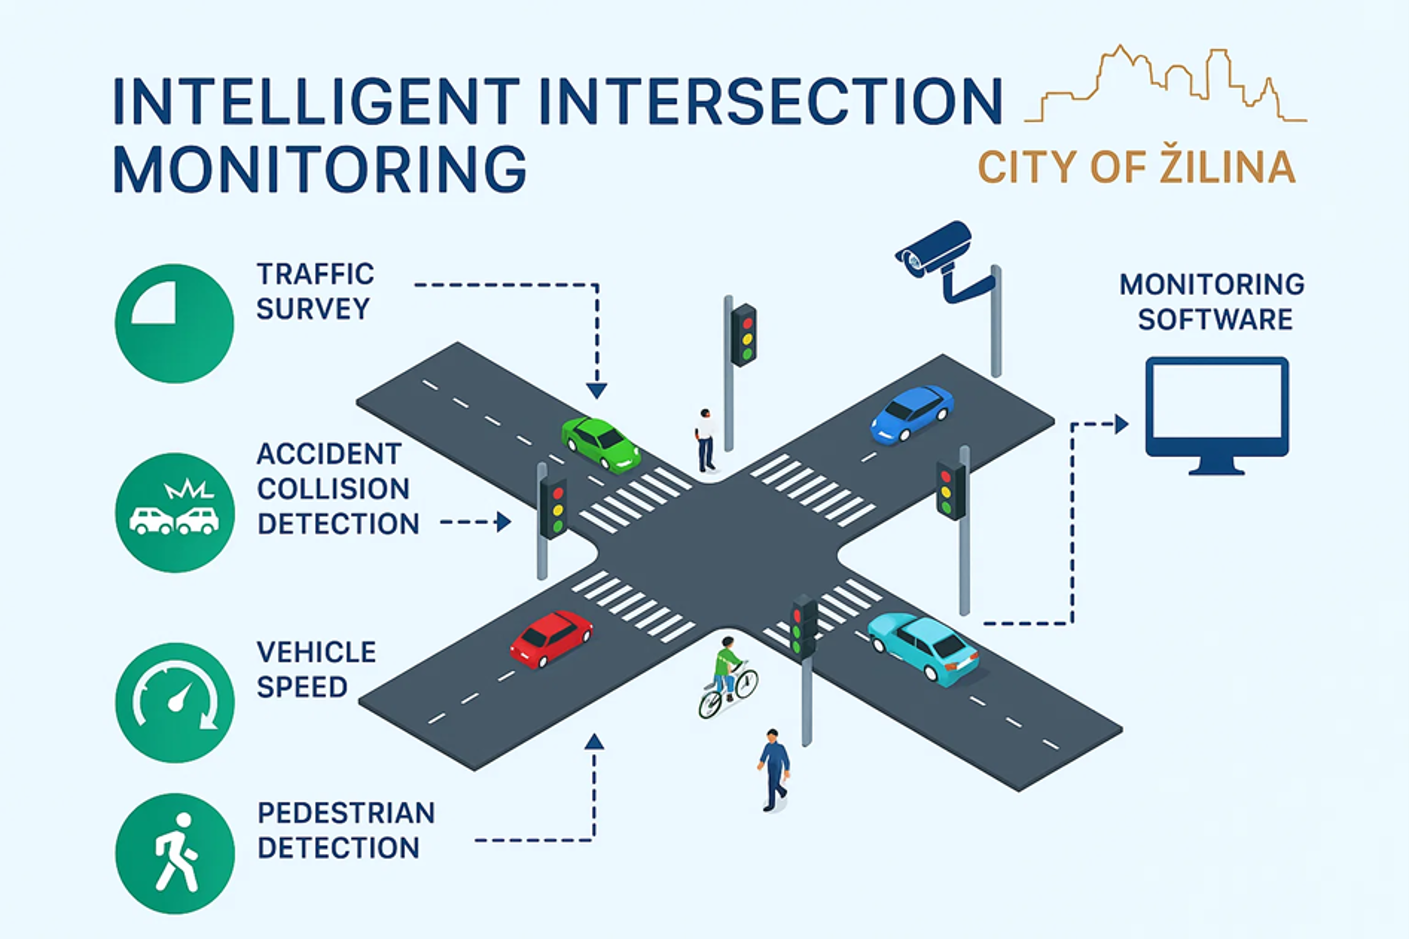
Intelligent Intersection Monitoring System schematic
How could intersection monitoring reshape traffic signal planning in your city?
Learning Objectives:
By the end of this module, learners will be able to:
- Compute KPIs from visual traffic data.
- Use KPIs to evaluate system performance.
Extracting Traffic Metrics for Public Transport Optimization
Key Performance Indicators (KPIs)
- Vehicle count per lane per minute: enabling accurate modeling of intersection capacity and congestion levels.
- Bus dwell time at intersection: tracking how long buses remained stationary, highlighting bottlenecks.
- Pedestrian crossing frequency: safer crossing intervals without unduly impacting bus schedules.
- Delay and headway between PT vehicles: identifying irregular bus spacing and service gaps
- Queue lengths and average wait times: improving dynamic traffic light control
These KPI extractions directly inform operational decisions, boosting efficiency and safety of public transport systems.
Real-Time Alerts
- PT delay > threshold: the system continuously monitors public transport system performance, comparing actual travel times against predefined acceptable limits. When delays exceed the threshold, an alert is generated, enabling rapid response from traffic control or operational teams to mitigate service disruption.
- Buses in unauthorized lanes: using CV, the system detects instances where public transport vehicles enter lanes not designated for their use. Such alerts help enforce compliance with lane regulations, ensuring smoother traffic flow and prioritization for buses in authorized corridors.
- Congestion warnings: real-time traffic density and queue length analysis identify when congestion is forming at or near monitored intersections. Early warnings allow operators to adjust signal timings, implement detours, or activate bus-priority measures before delays escalate.
Visualization
- Interactive maps: operators can view live traffic and public transport conditions on a GIS-based map interface. Data layers include vehicle positions, congestion hotspots, and pedestrian crossing activity, allowing quick interpretation and decision-making
- 3D simulation in Digital Twin environment: a virtual model of the city intersection network simulates current and predicted traffic states using live KPI inputs. This immersive view supports scenario testing, such as the impact of traffic lights timing changes or lane reassignments, before applying them in the real world.
Near-miss Incident Detection
The system leverages CV and trajectory analysis to identify situations where two or more road users – such as buses, cyclists, pedestrians, or cars – come into dangerously close proximity without an actual collision. These events are strong indicators of underlying safety risks that may not be captured through traditional accident statistics. Detected near-misses are automatically logged with metadata including time, location, mode types involved, and the distance or time-to-collision at the point of risk. This enables:
- Hotspot Identification: pinpointing locations with repeated close-call incidents.
- Proactive Safety Measures – adjusting traffic lights timings, redesigning lane markings, or adding dedicated crossings before serious accidents occur.
- Performance Tracking: measuring the effectiveness of safety interventions over time by monitoring changes in near-miss frequency.
When combined with KPI dashboards and Digital Twin simulations, near-miss detection provides a powerful tool for proactive safety management in public transport networks.
Which KPI would be most useful for your transport operations? Why?
Learning Objectives:
- Analyzing public transport flows using KPIs: to assess efficiency, reliability, accessibility and user satisfaction, with a particular focus on strategies to increase the modal share of public transport.
- Scenario modeling and conducting simulations: to explore the potential impacts of different interventions, including the adoption of digital solutions. These simulations help assess how digital innovations can improve service quality, optimize resource allocation, and ultimately reduce reliance on private cars
Key Concepts and Content
- Applying KPIs to optimize public transport efficiency.
- Data-driven sustainable urban mobility frameworks and strategies.
- Translating technical insights into actionable policies and communicating findings to stakeholders.
Case studies
Intelligent Intersection Monitoring in Žilina
The City of Žilina, as part of the SPINE project’s Living Lab activities, is deploying an advanced Intelligent Incident Identification and Intersection Monitoring solution. This system is designed to enhance traffic management, improve public transport reliability, and strengthen road safety across the city. Covering 10 strategic intersections, each equipped with four high-definition cameras, the solution leverages cutting-edge CV and DT technologies to deliver real-time information and analytics on traffic conditions at each intersection.
Key Functionalities
The solution provides a comprehensive suite of monitoring and analytical capabilities:
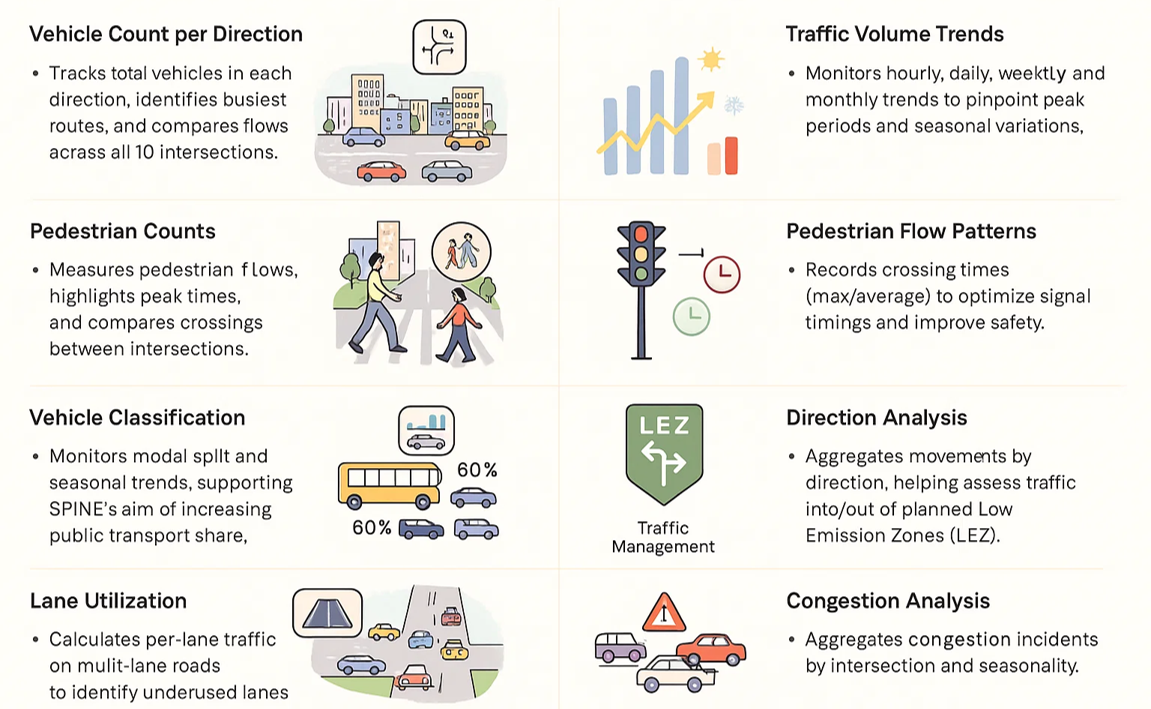
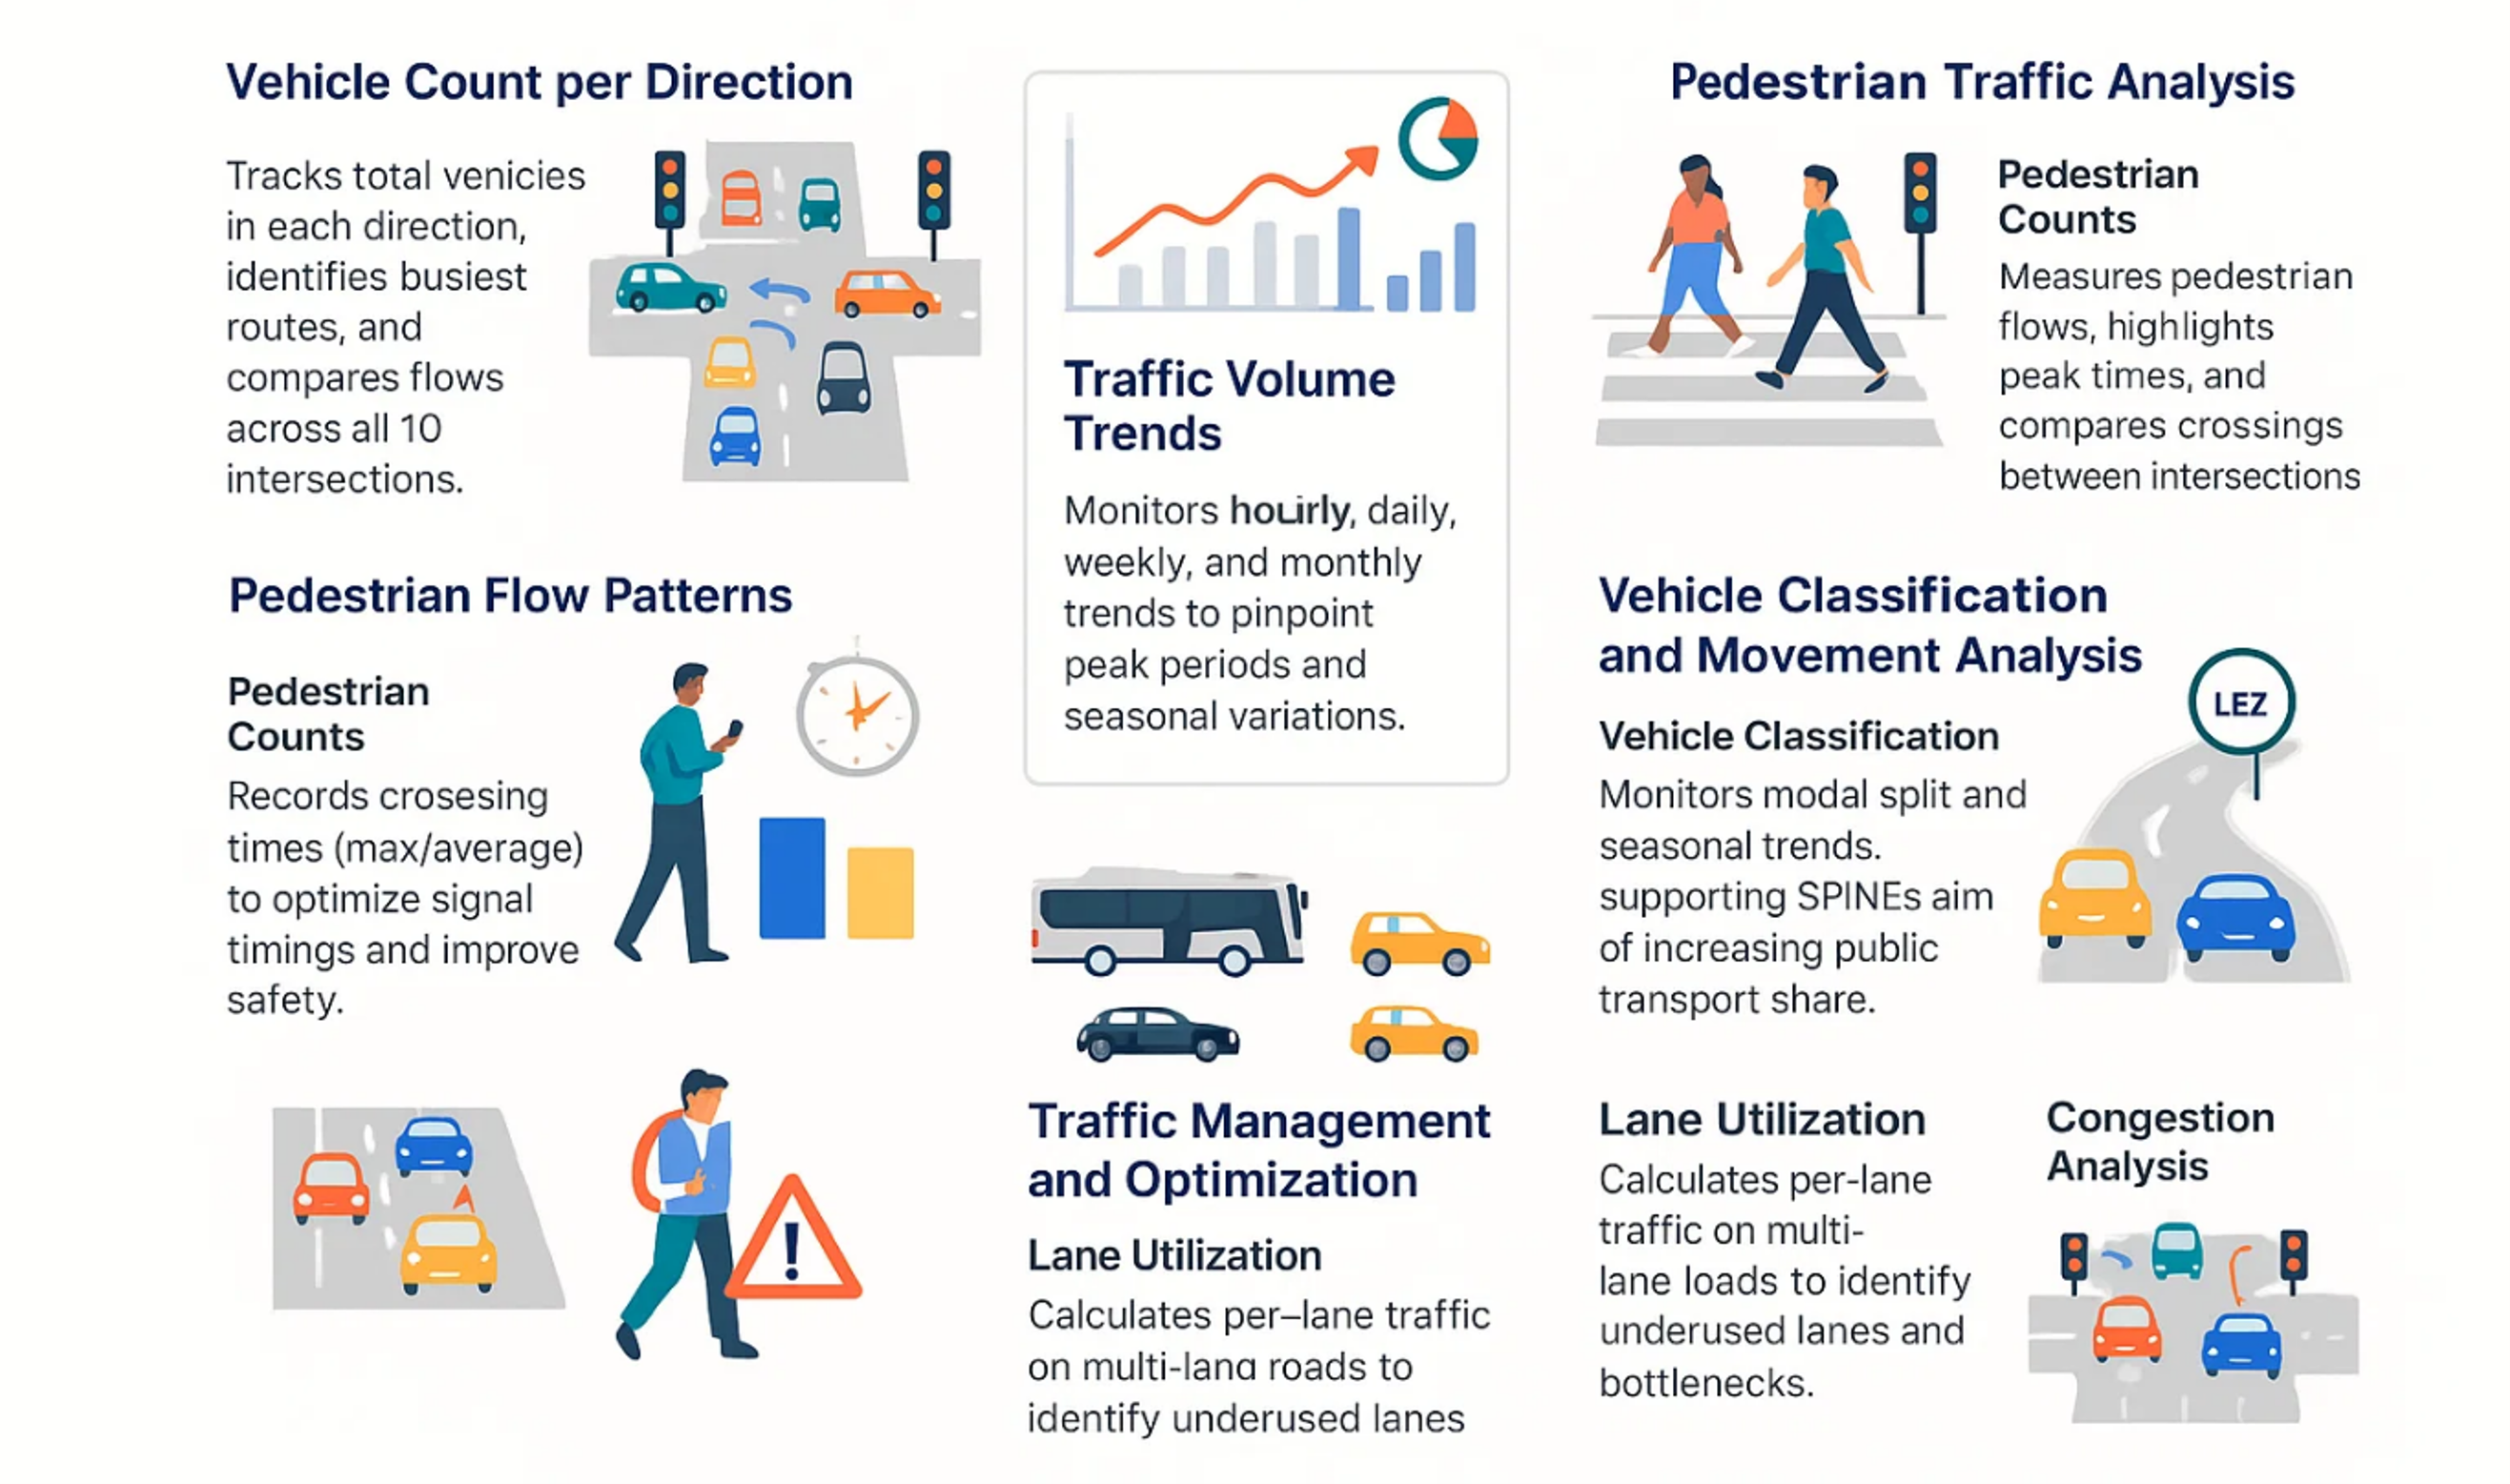
- Traffic Volume and Classification: counts vehicles and pedestrians in real-time, classifies vehicle types (cars, buses, trucks, bicycles), and identifies seasonal or daily traffic patterns.
- Directional Flow Analysis: tracks vehicle trajectories to understand movement patterns and inform urban mobility strategies, including low-emission zone planning.
- Lane Utilization and Congestion Detection: measures lane occupancy rates, detects bottlenecks, and generates early congestion alerts for proactive traffic control.
- Accident and Incident Detection: utilizes anomaly detection algorithms to identify potential collisions or irregular behaviors, triggering instant alerts to operators.
- Pedestrian Flow Monitoring: counts pedestrian crossings, identifies peak usage times, and informs signal timing adjustments to balance safety and efficiency.
Technical Approach
The CV pipeline is based on YOLO object detection for identifying vehicles, pedestrians, and cyclists. Homography estimation ensures accurate camera calibration for distance and speed measurements. Feature extraction enables multi-camera tracking across intersection approaches. All processed data is securely transmitted to the Digital Twin platform, stored in TimescaleDB, and made available for real-time analytics and historical trend analysis.
Impact
This use case marks Žilina’s first deployment of a fully integrated traffic data analytics platform. It empowers city planners and traffic managers with actionable intelligence for evidence-based decision-making. The platform supports public transport punctuality by identifying and mitigating delays, enhances road safety through near-miss detection, and contributes to sustainable mobility planning by aligning traffic management with environmental goals.
Dashboards
The figures below illustrate the main dashboards supporting the Intelligent Intersection Monitoring solution.
Figure 1 shows the city of Žilina with indicators for each monitored intersection. The indicator color represents traffic volume levels, determined by the number of vehicles passing through at set time intervals. A standard three-color scheme has been adopted, with threshold values dynamically calculated from data collected during the project.
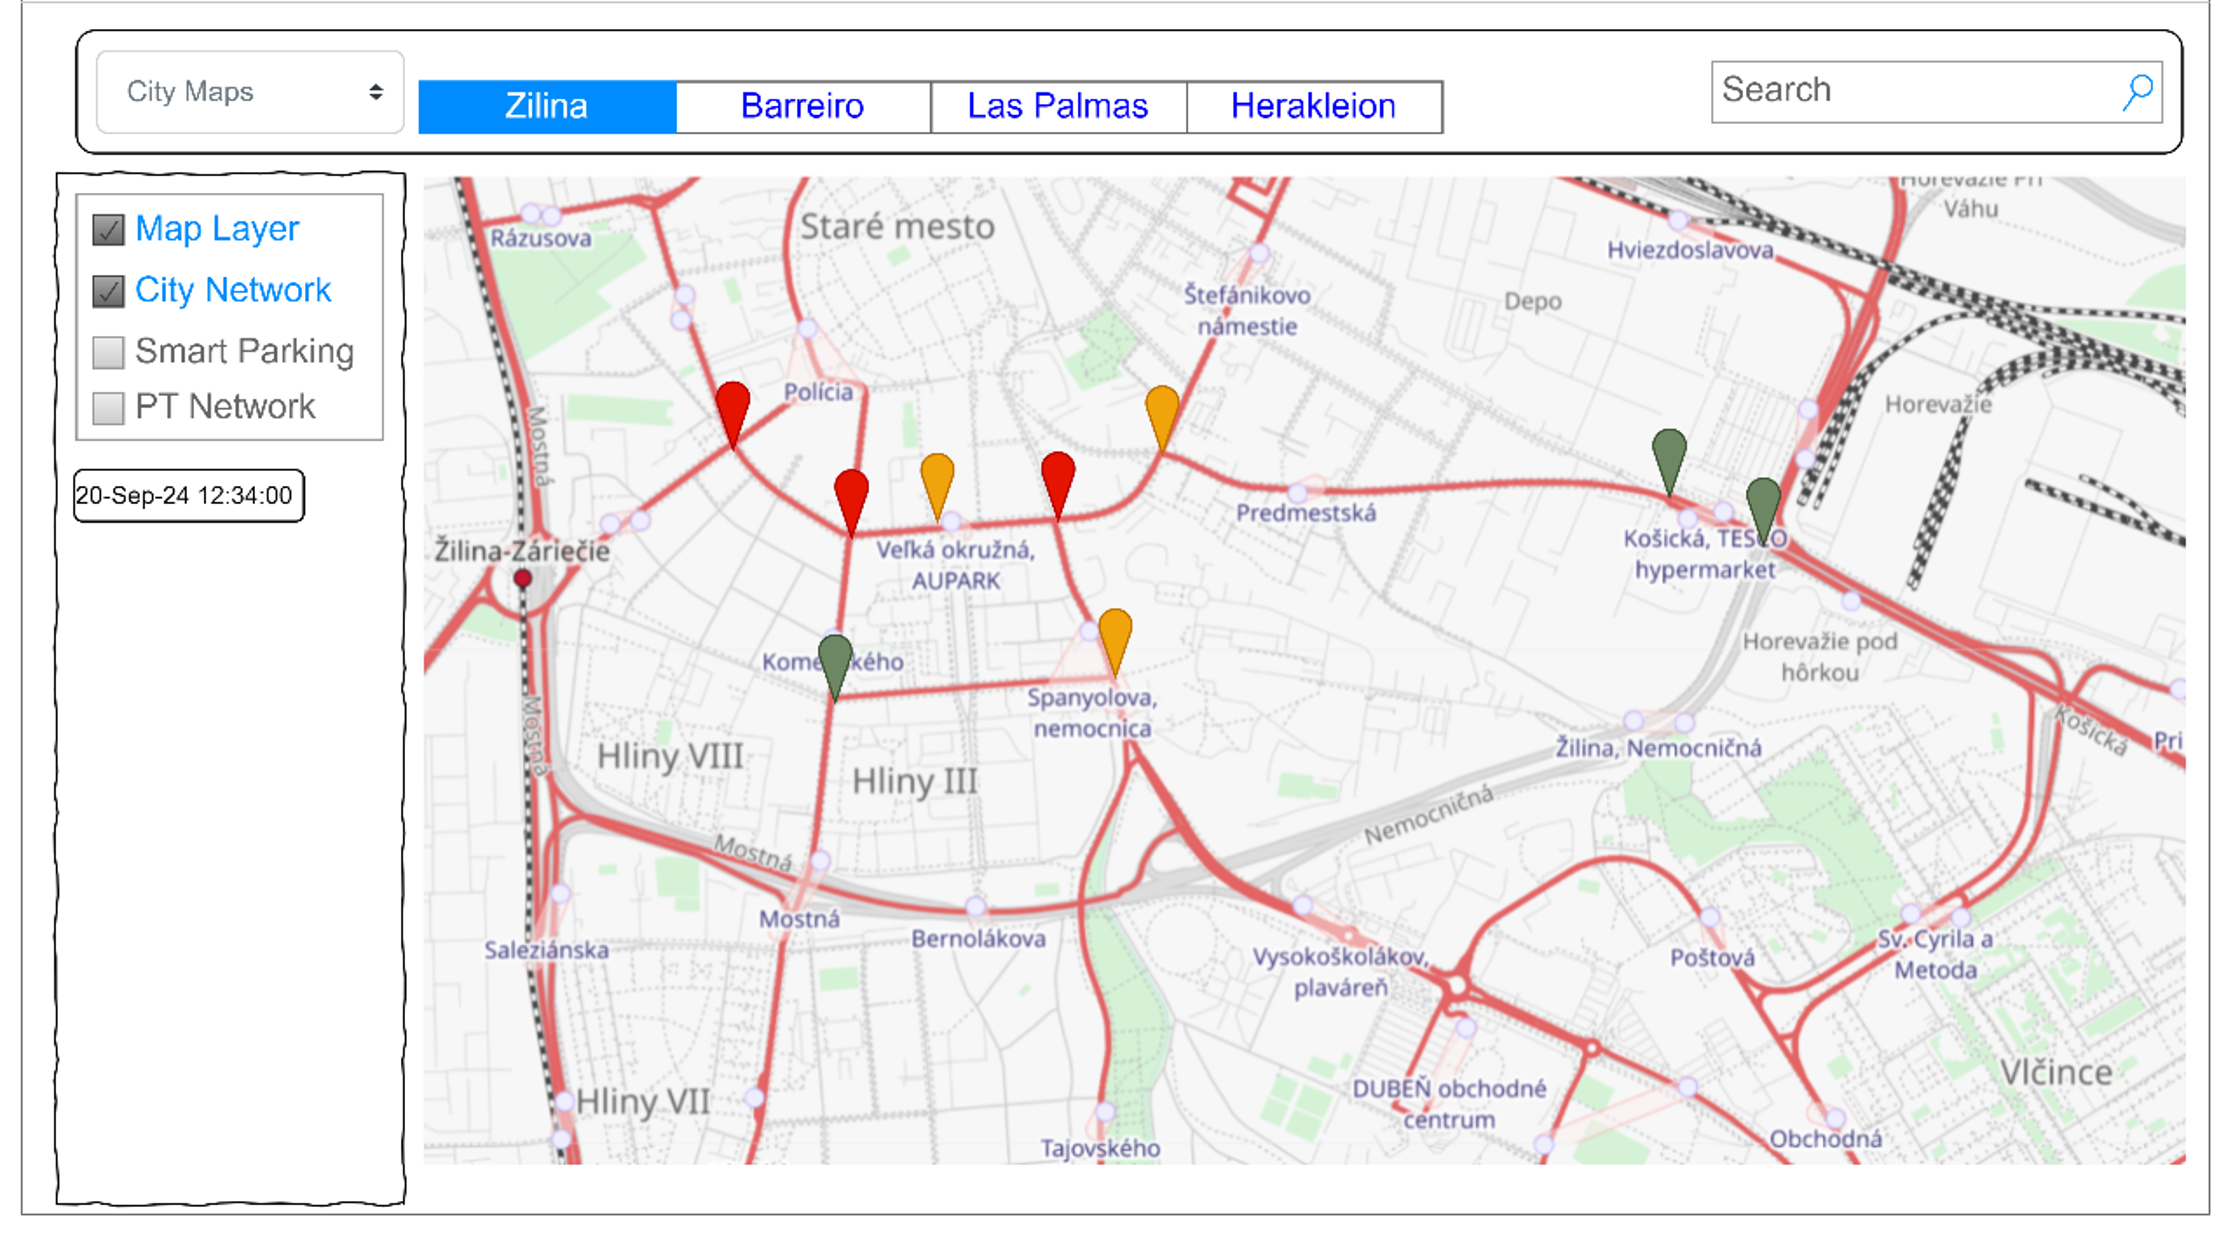
Figure1 – Overview of Intersections Status (Source SPINE D3.1)
By recording vehicle counts at different times of day and across days of the week, the system can address the most common traffic analytics scenarios. Historical data will also be used to calculate average traffic volumes and standard deviations for each intersection, while identifying peak volumes to understand maximum capacity. The three traffic levels will be defined dynamically by comparing current traffic to these averages. This methodology, implemented in the Intersection Occupancy Level model, will update calculations daily for greater accuracy.
In special cases, such as congestion or accidents, traffic flow may drop to zero. To address this, the CV models will detect such anomalies and trigger alerts to the DT platform. The system will also estimate queue lengths at traffic lights, although camera positioning may limit precision.
Figure 2 presents a city map with monitored intersections and their corresponding indicators. Users can interact with the map to view traffic data for specific intersections or receive push notifications about incidents. Automatic dispatch of first responders is not included due to the risk of false positives, primarily caused by the limited availability of local historical video data. As a result, CV model training relies on open-source datasets, making live demonstrations of certain incidents- especially accidents – less reproducible.
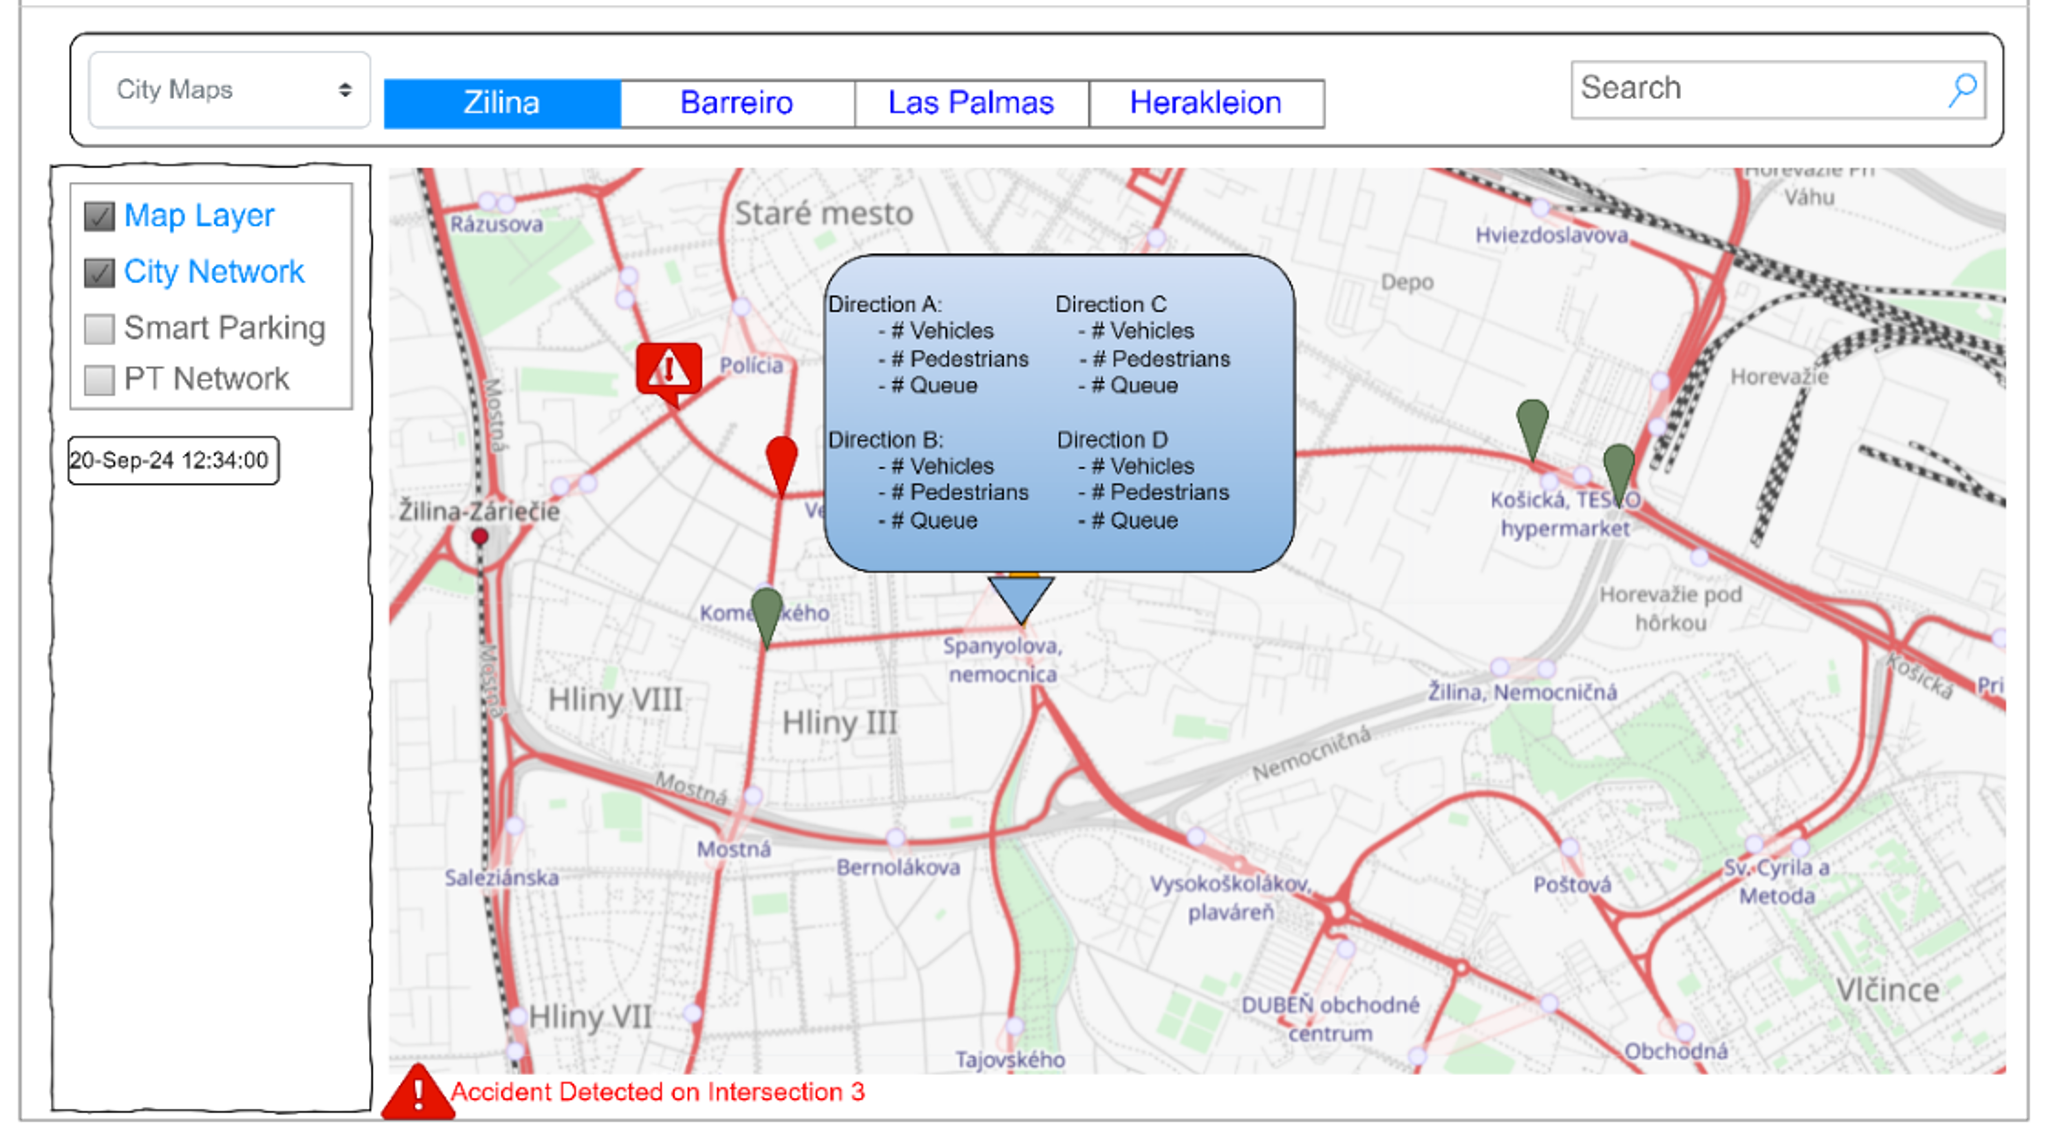
Figure2 – Intersection Information widget and alarming (Source SPINE D3.1)
Figure 3 provides examples of analytical diagrams available on the platform. These analytics are accessible per intersection for detailed local insights, as well as at city level to reveal broader mobility patterns.
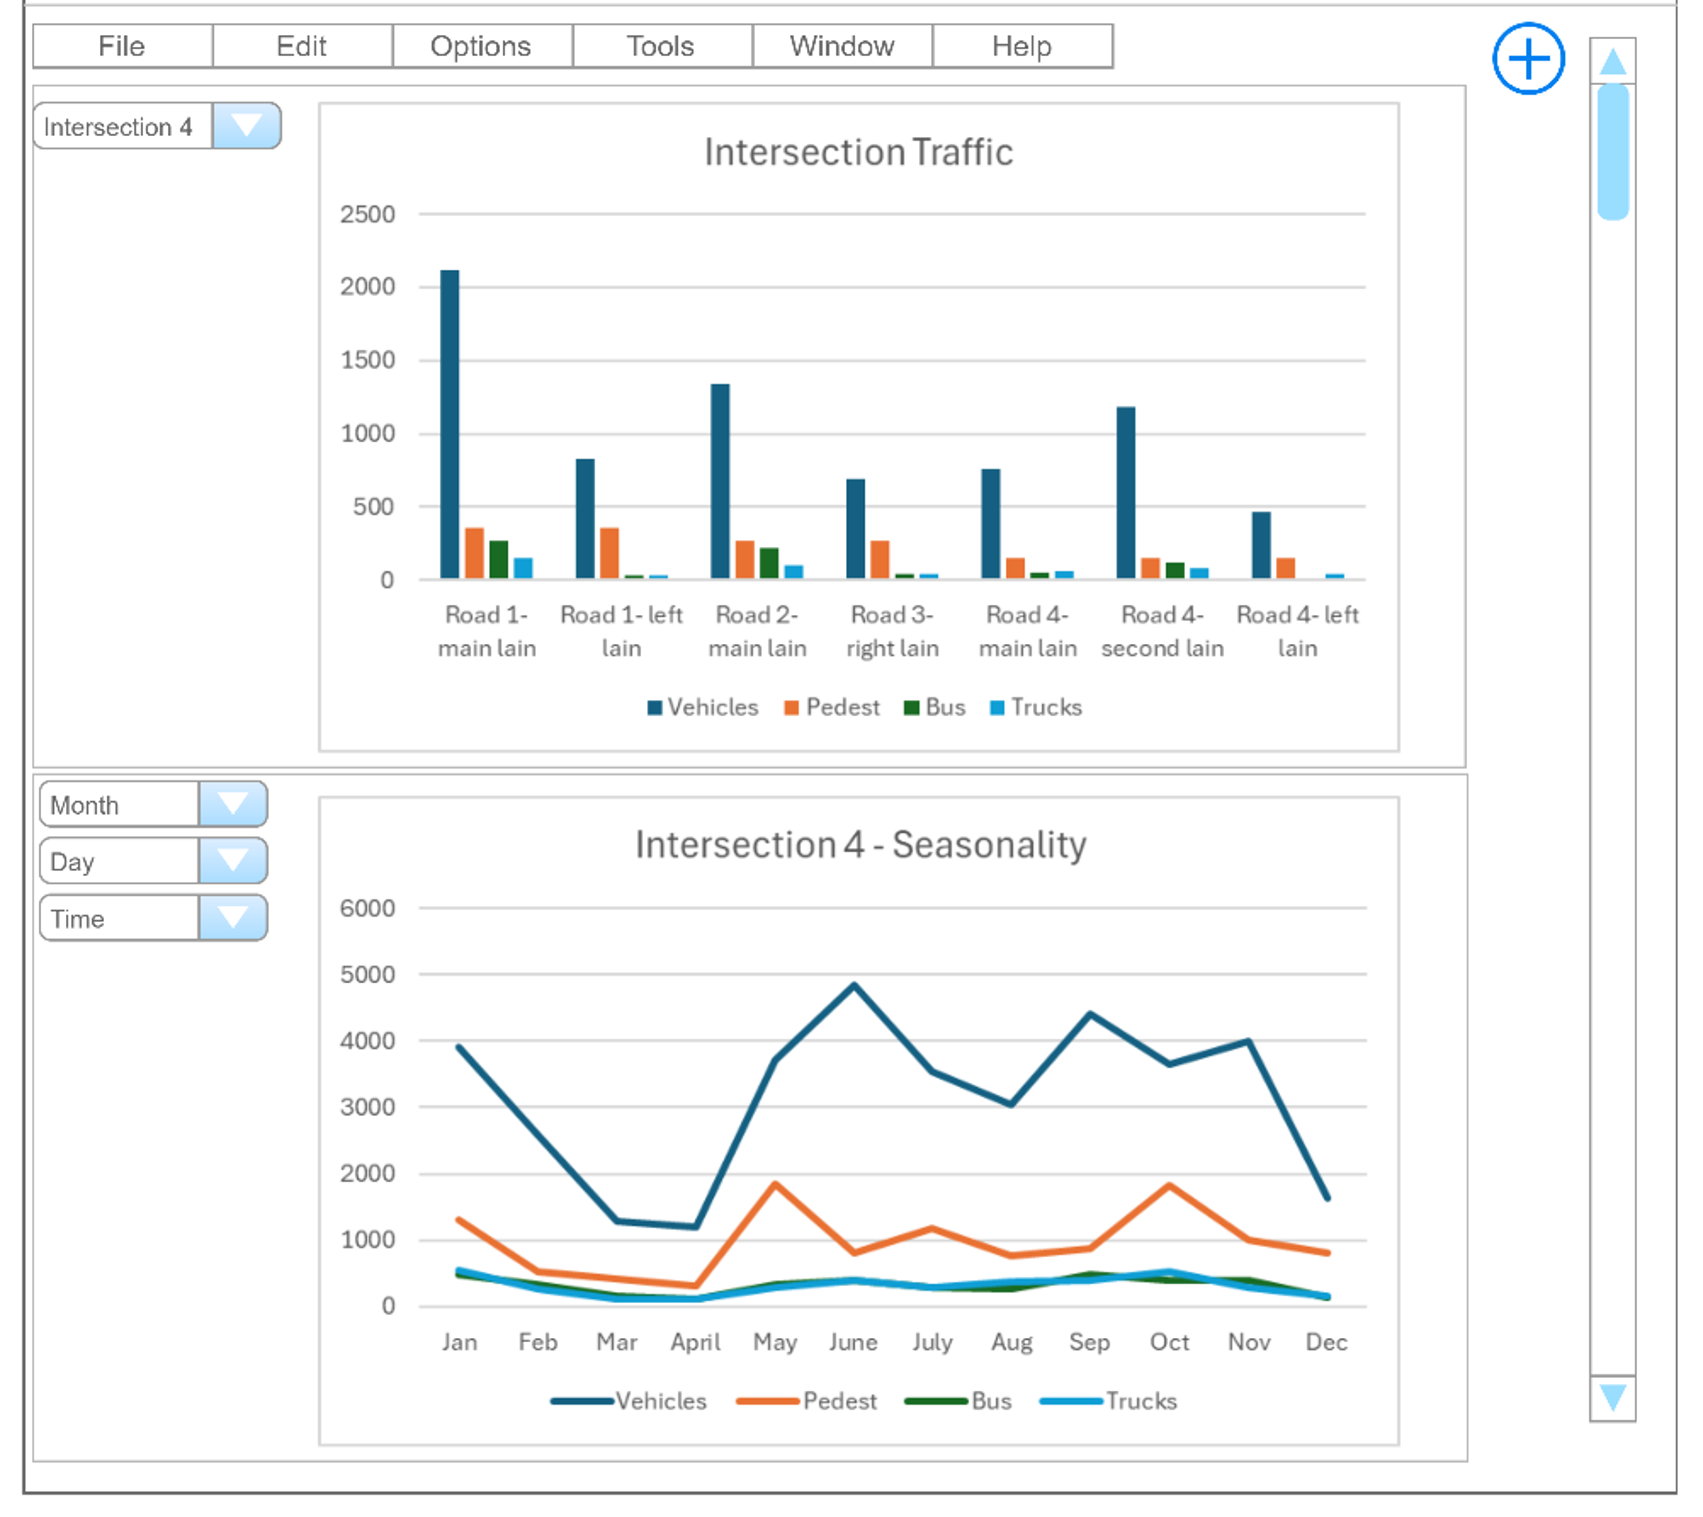
Figure3 – Intersection Monitoring Analytics (Source SPINE D3.1)
Identified Analytics for Žilina
or
Case Study: Bus Occupancy Monitoring in Barreiro
The City of Barreiro, within the framework of the SPINE Living Lab activities, has introduced an innovative Bus Occupancy Monitoring solution to enhance public transport efficiency, reliability, and attractiveness. The initiative, led by the local bus operator TCB, aims to provide real-time occupancy data to passengers through a mobile application, allowing them to make informed choices based on seat availability and route congestion. In addition, historical occupancy data will help optimize services and improve the network.
Key Functionalities
The solution offers several critical monitoring and analytical capabilities:
- Real-Time Occupancy Monitoring: counts passengers boarding and alighting using cameras at vehicle doors, enabling TCB’s app to display available capacity.
- Passenger Analytics: provides daily, weekly, and seasonal trends to identify demand peaks and improve service planning.
- Origin–Destination Matrix: combines passenger counts with bus GPS data to inform route optimization, scheduling, and fleet management.
- Demand Analysis: identifies long-term demand patterns across time periods to support urban mobility strategies.
- Fare System Integration: potential to connect passenger counts with ticketing systems for insights into revenue generation and fare evasion
Technical Approach
The Bus Camera Service forms the system’s backbone:
- Certified cameras installed on 10 pilot buses count passengers while complying with GDPR (only numerical data transmitted).
- CV algorithms process data onboard to ensure privacy and accuracy.
- Data is fused with geolocation signals and transmitted via the SPINE Dataspace to the DT Platform, which stores, analyzes, and distributes information.
- Information is also transformed into GTFS-RT format to integrate with the MaaS app (Instant Systems), providing passengers real-time bus occupancy updates.
The DT Platform hosts models such as Bus Occupancy RT Handler and Bus Occupancy Analytics, enabling both real-time dashboards and historical data analysis.
Impact
This pilot marks Barreiro’s first digital integration of real-time passenger flow data into daily transport operations. It is expected to:
- Enhance Passenger Experience: Passengers can select less crowded buses in real time, increasing satisfaction and confidence in PT.
- Support Evidence-Based Planning: TCB can analyze long-term patterns to optimize routes, timetables, and fleet allocation.
- Encourage Modal Shift: Improved transparency and reliability of PT can attract new users, reducing reliance on private cars.
- Enable Future Expansion: Scalable design supports integration with broader MaaS ecosystems and sustainability-oriented transport planning.
Dashboards
The solution’s effectiveness is visualized through dashboards and analytics tools:
Figure 4 – Bus Occupancy Dashboard – Displays a real-time map of Barreiro, with each bus color-coded by occupancy level (Green: <26 passengers, Yellow: 27–55, Red: >55). Users can select buses to view details such as passenger count, route, and bus ID.
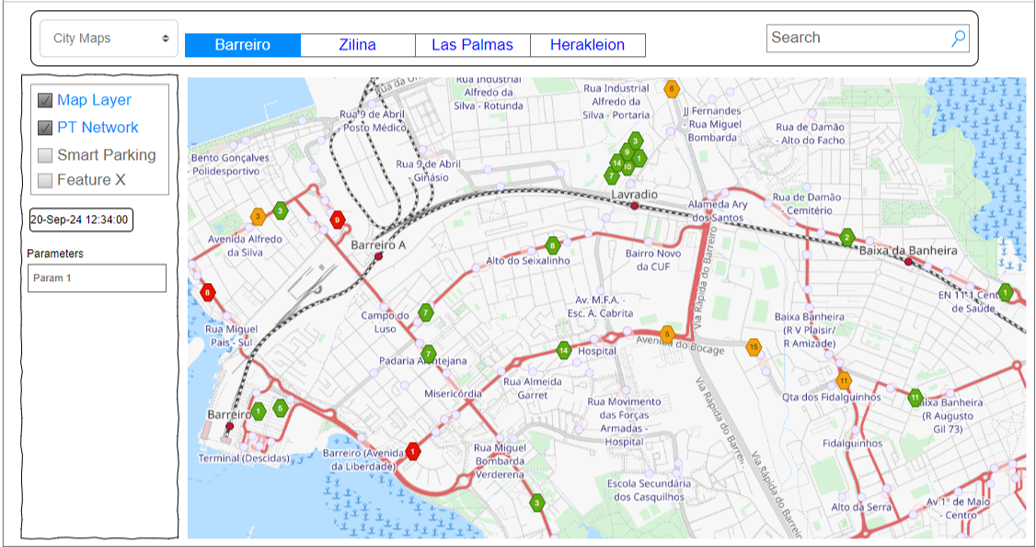
Figure 4 – Dashboard for Bus Occupancy solution
Figure 5 – Bus Occupancy Analytics- provides deeper insights including: passenger counts per route and stop, onboarding/offboarding numbers, seasonal variations in demand, and Origin–Destination (O-D) matrices for fleet and route optimization.
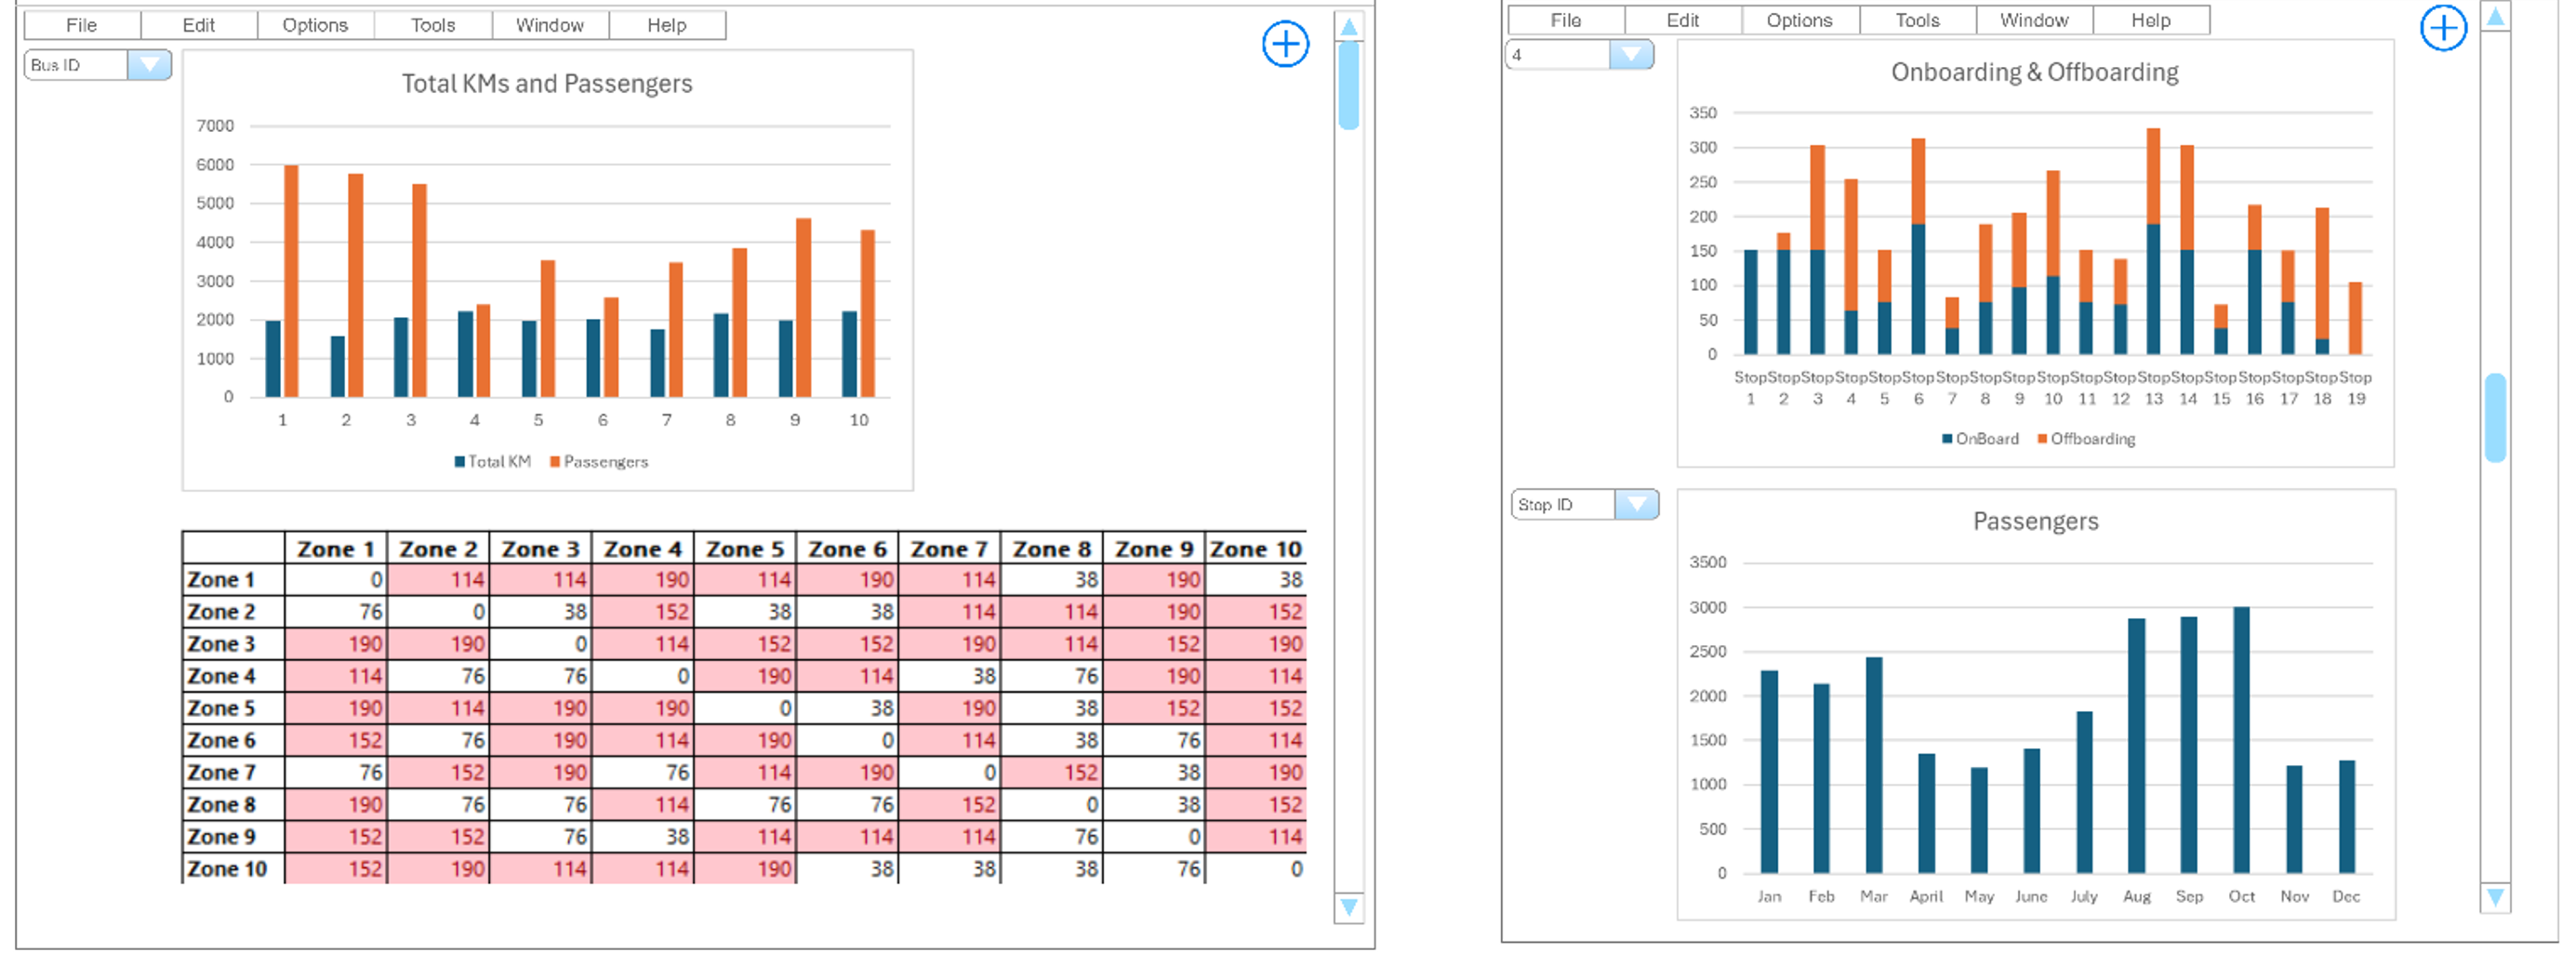
Figure 5 – Bus Occupancy Analytics
What challenges would you face in implementing a bus occupancy monitoring system in your city?